

Renewable Energy
Find latest News, Industry Updates, Markets, Finance, Policies and Regulations, Tenders
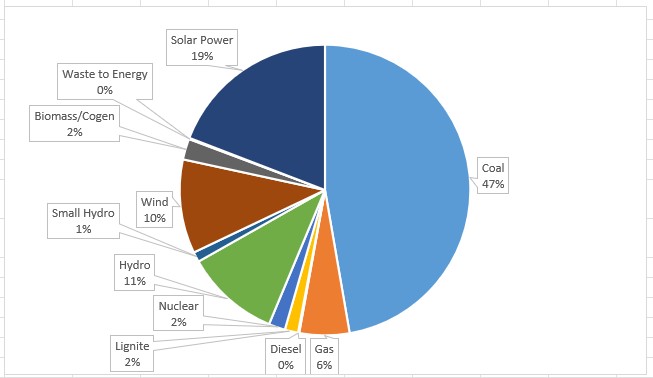
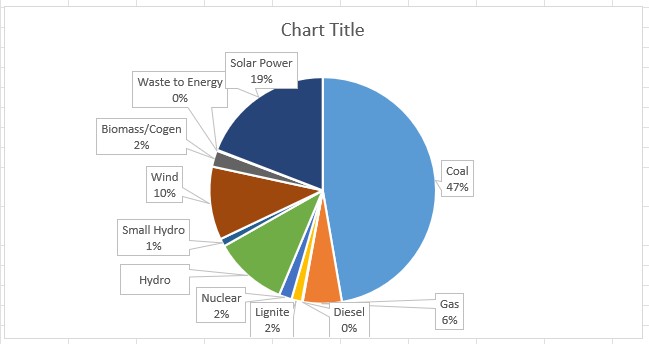
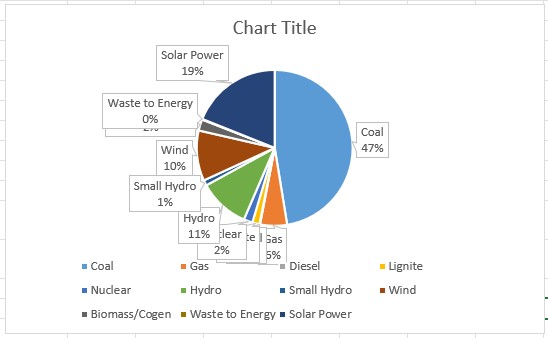
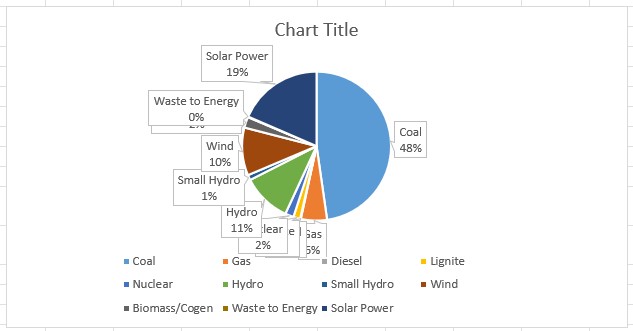
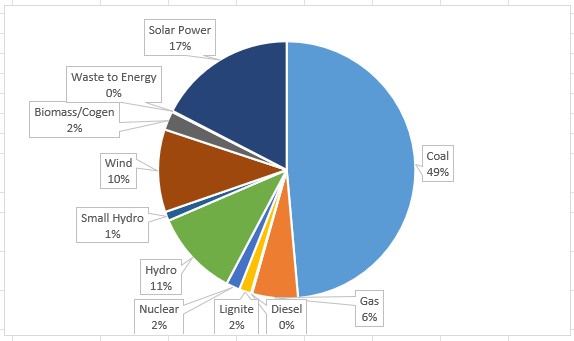
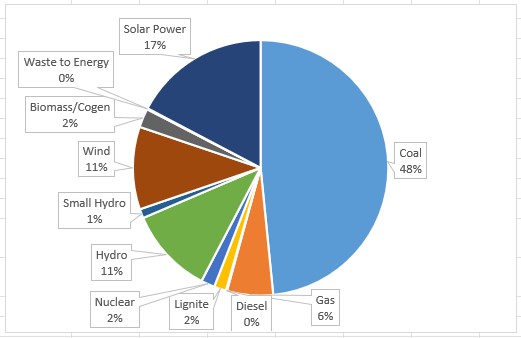
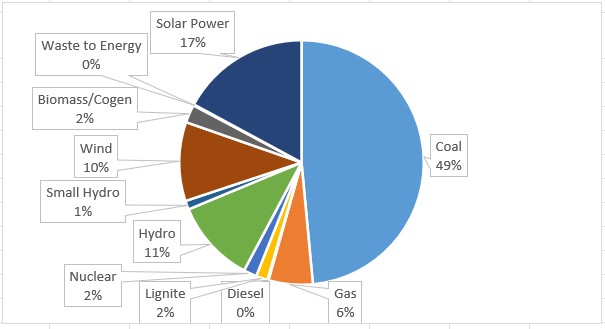
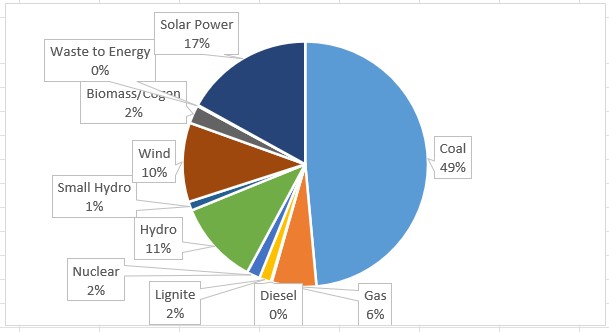
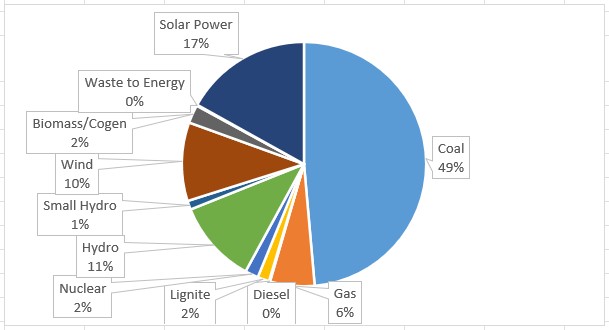
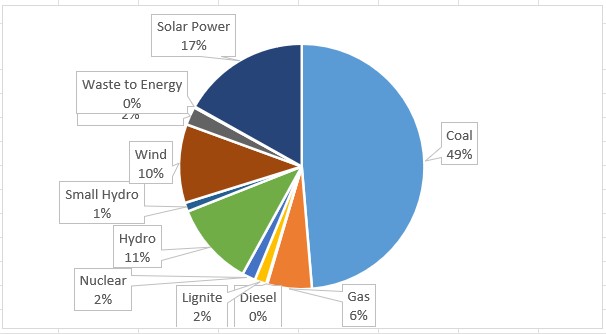
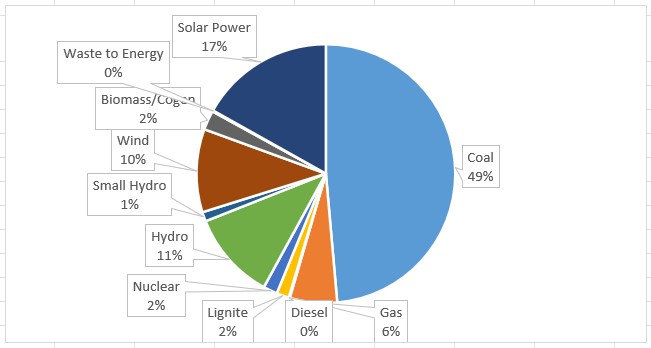
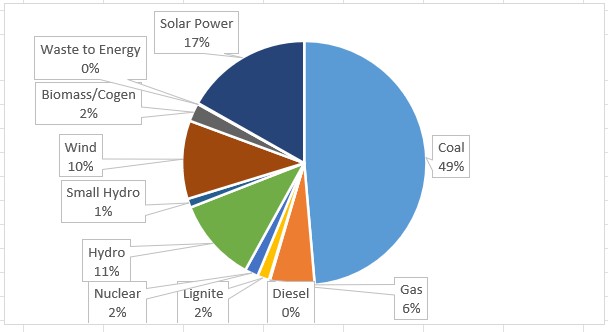
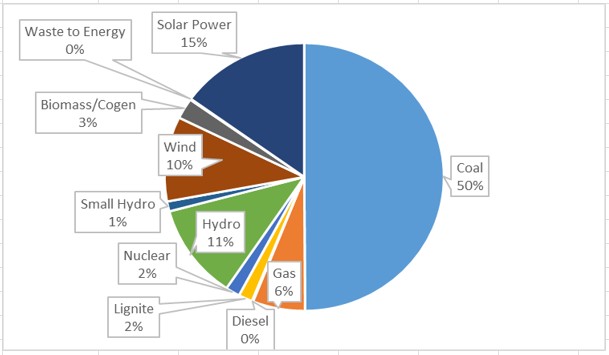
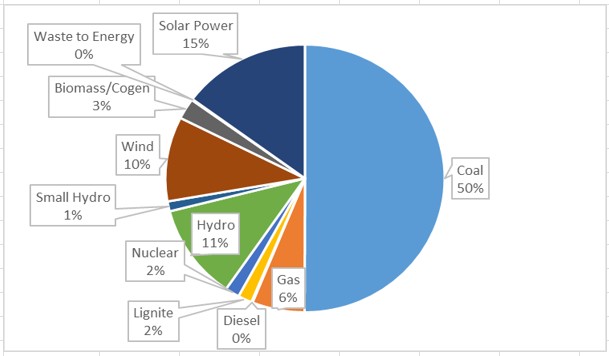
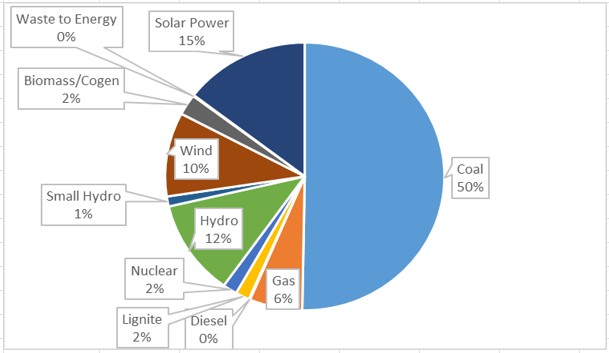
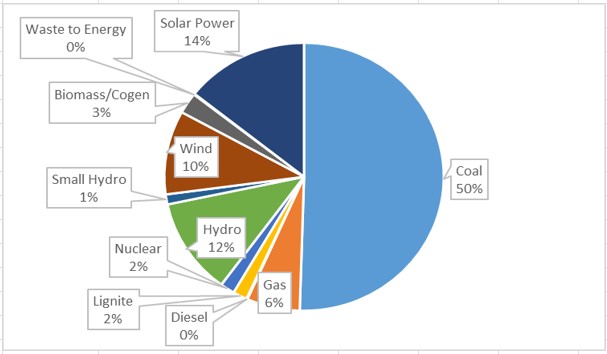
Monthly installed capacity
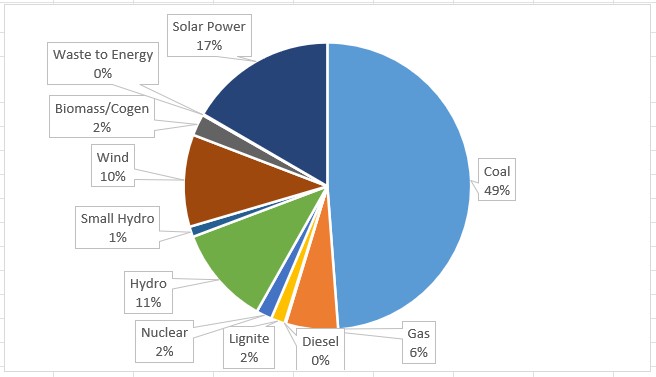
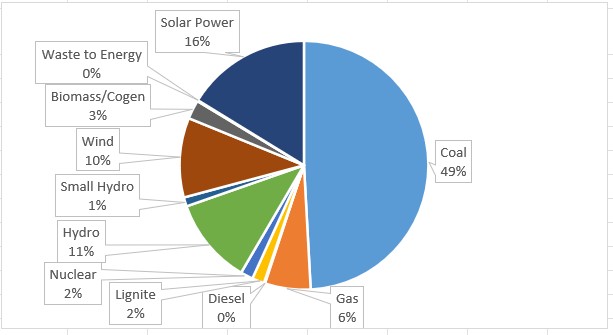
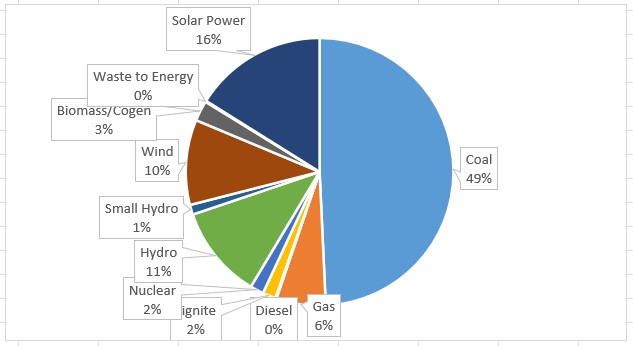
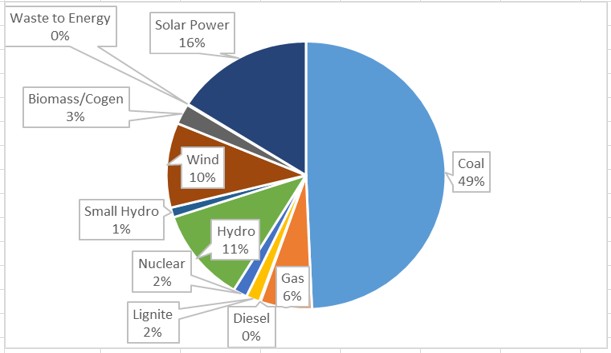
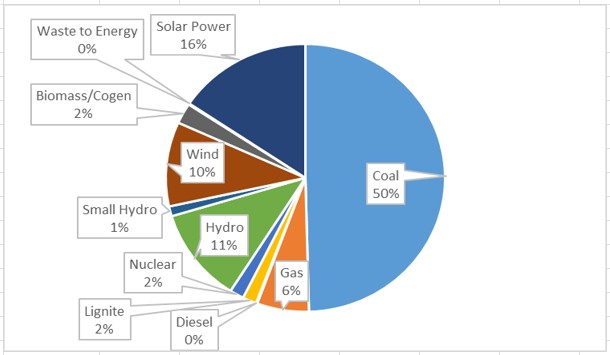
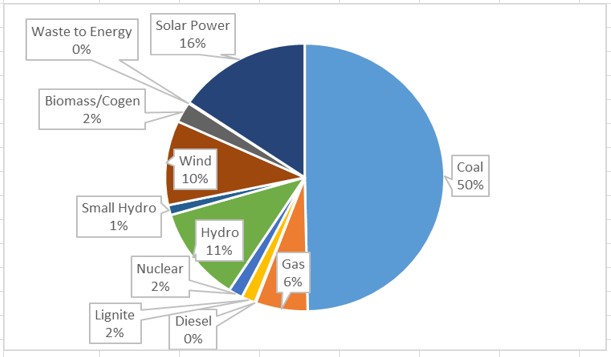
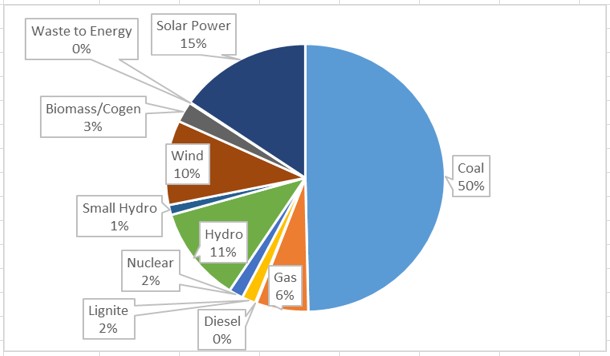
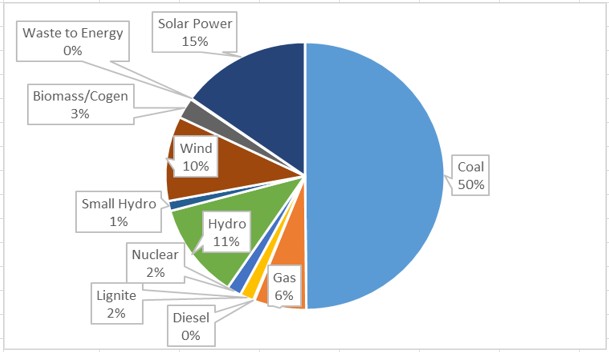
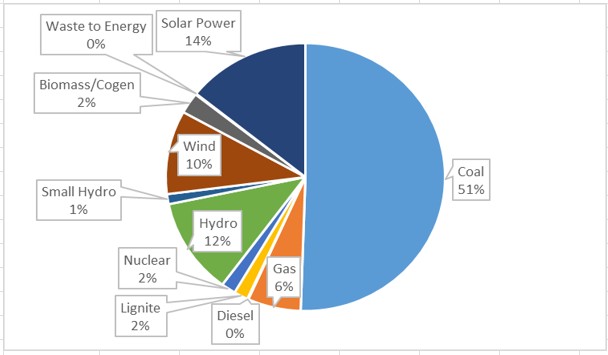
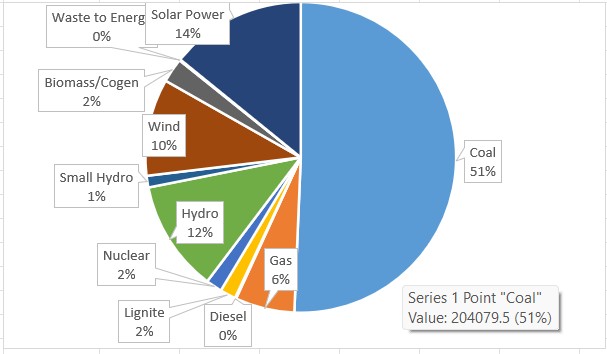
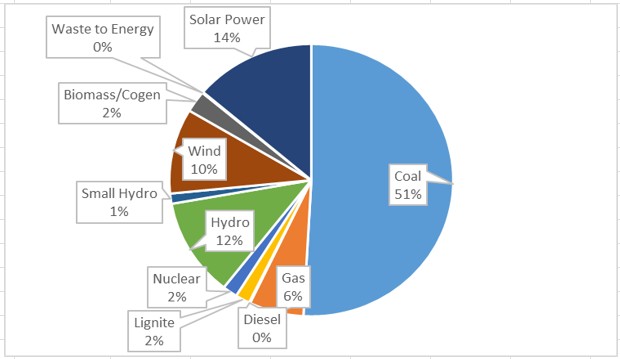
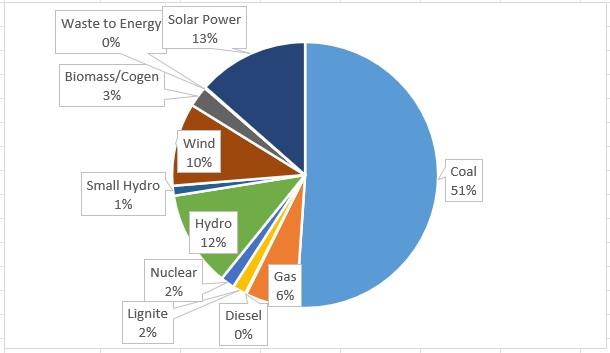
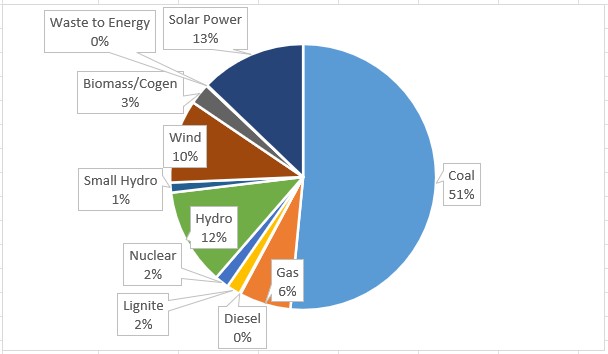
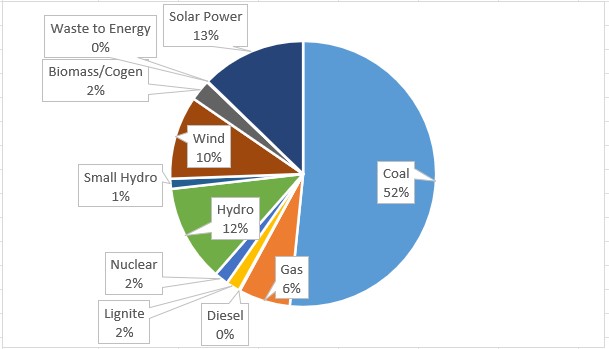
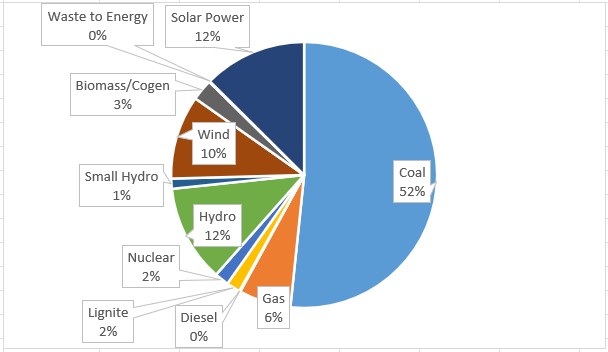
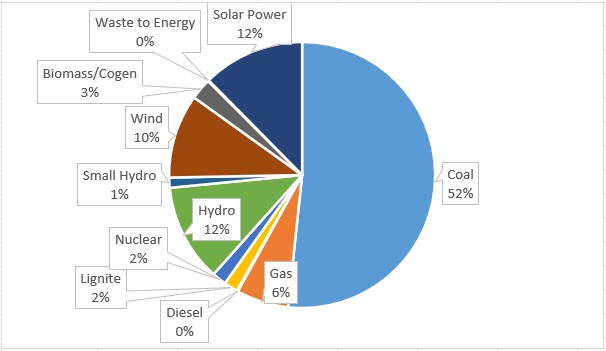
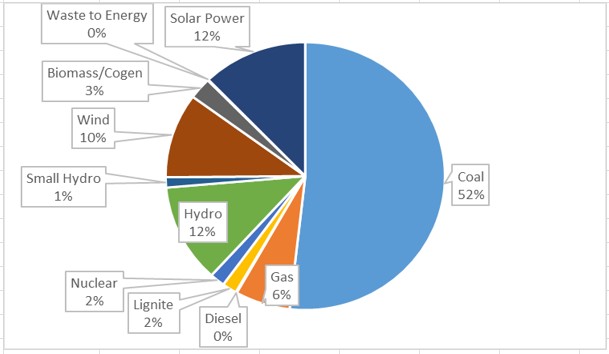
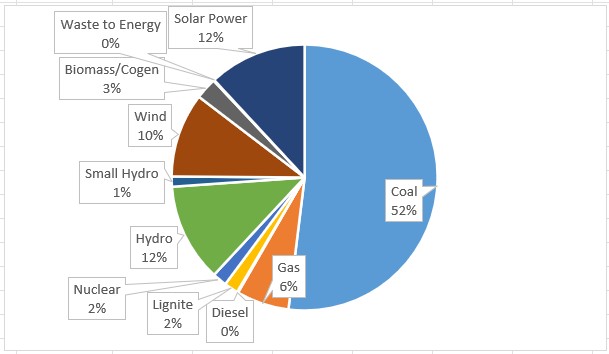
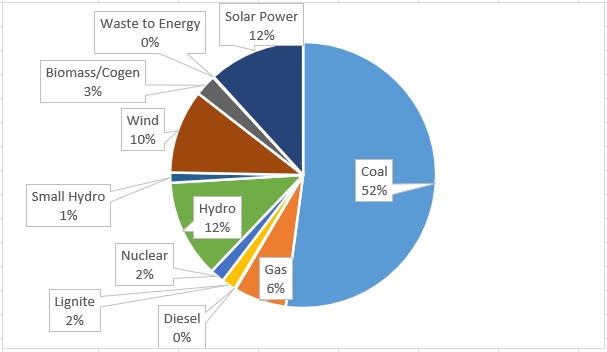
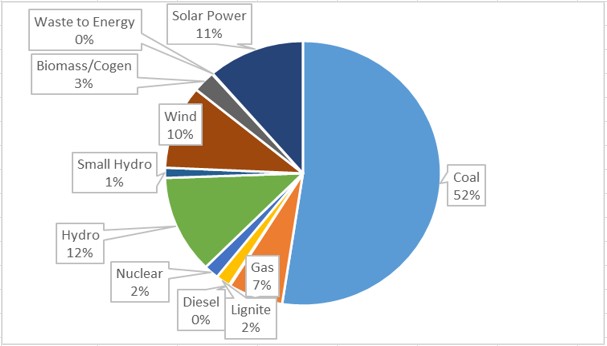
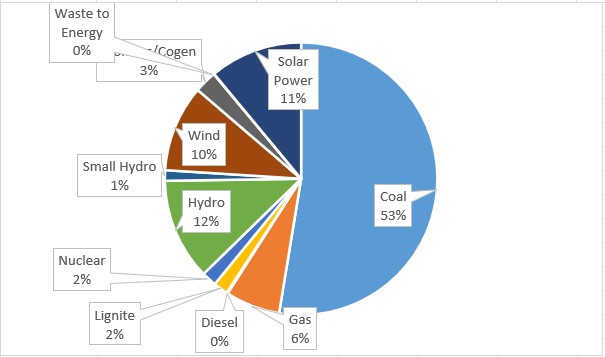
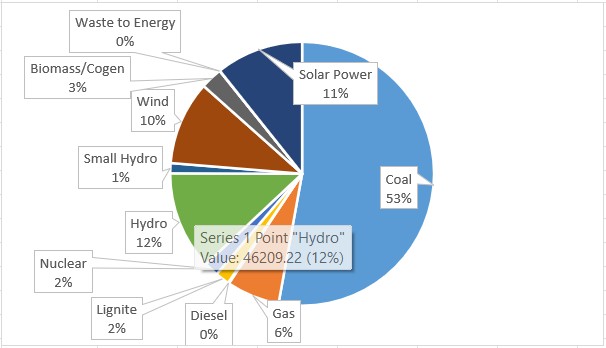
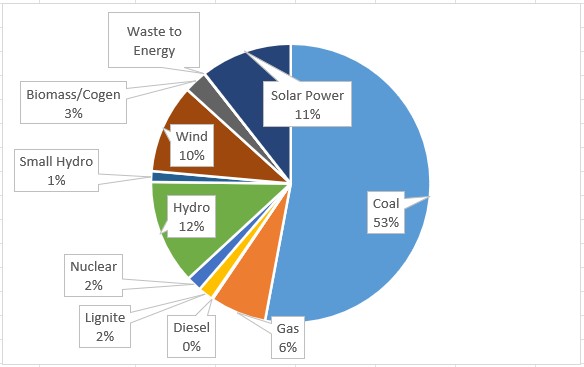
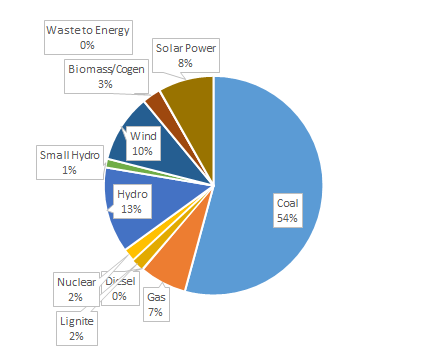
The monthly installed capacity of renewable energy technologies has been increasing gradually. Similar trend is observed for conventional source based technologies. But the percentage share of renewable energy in total monthly installed capacity is increasing over years whereas that for conventional technologies has been decreasing gradually. Within renewable energy sector solar installed capacity has been increasing rapidly on monthly basis whereas the rate of increase in installed capacity is slow for other renewable energy technologies. Although the installed capacity for conventional source based technologies has been increasing gradually, there percentage share in total installed capacity is decreasing gradually meaning a proportionately less increase in the installed capacity of conventional source based energy as compared total capacity increase.
July 2024 | June 2024 | May 2024 | April 2024 | March 2024 | February 2024 | January 2024 | December 2023 | November 2023 | October 2023 | September 2023 | August 2023 | July 2023 | June 2023 | May 2023 | April 2023 | March 2023 | February 2023 | January 2023 | December 2022 | November 2022 | October 2022 | September 2022 | August 2022 | July 2022 | June 2022 | May 2022 | April 2022 | March 2022 | February 2022 | January 2022 | December 2021 | November 2021 | October 2021 | September 2021 | August 2021 | July 2021 | June 2021 | MAy 2021 | April 2021 | March 2021 | February 2021 | January 2021 | December 2020 | November 2020 | August 2020 | June 2020 | May 2020 | Apr 2020 | Mar 2020 | Feb 2020 | Jan-2020 | Dec-2019 | Nov-2019 | Oct-2019 | Sept-2019 | Aug-2019 | July-2019 | June-2019 | May-2019 | April-2019 | March-2019 | February-2019 | January-2019 | December-2018 | November-2018 | October-2018 | September-2018 | August-2018 | July-2018 | June-2018 | May-2018 | April-2018 | March-2018 | February-2018 | January-2018July 2024
(As on 31.07.2024)
*RE Installed Capacity Data are as on 31.07.2024 |
 |
||||||||||||||||||||||||||||||||||||||||||||||||||||||||||||||||||||||
June 2024
(As on 30.06.2024)
*RE Installed Capacity Data are as on 30.06.2024 |
 |
||||||||||||||||||||||||||||||||||||||||||||||||||||||||||||||||||||||
May 2024
(As on 31.05.2024)
*RE Installed Capacity Data are as on 31.05.2024 |
 |
||||||||||||||||||||||||||||||||||||||||||||||||||||||||||||||||||||||
April 2024
(As on 30.04.2024)
*RE Installed Capacity Data are as on 30.04.2024 |
 |
||||||||||||||||||||||||||||||||||||||||||||||||||||||||||||||||||||||
March 2024
(As on 31.03.2024)
*RE Installed Capacity Data are as on 31.03.2024 |
 |
||||||||||||||||||||||||||||||||||||||||||||||||||||||||||||||||||||||
February 2024
(As on 29.02.2024)
*RE Installed Capacity Data are as on 29.02.2024 |
 |
||||||||||||||||||||||||||||||||||||||||||||||||||||||||||||||||||||||
January 2024
(As on 31.01.2024)
*RE Installed Capacity Data are as on 31.01.2024 |
 |
||||||||||||||||||||||||||||||||||||||||||||||||||||||||||||||||||||||
December 2023
(As on 31.12.2023)
*RE Installed Capacity Data are as on 31.12.2023 |
 |
||||||||||||||||||||||||||||||||||||||||||||||||||||||||||||||||||||||
November 2023
(As on 30.11.2023)
*RE Installed Capacity Data are as on 30.11.2023 |
 |
||||||||||||||||||||||||||||||||||||||||||||||||||||||||||||||||||||||
October 2023
(As on 31.10.2023)
*RE Installed Capacity Data are as on 31.10.2023 |
 |
||||||||||||||||||||||||||||||||||||||||||||||||||||||||||||||||||||||
September 2023
(As on 30.09.2023)
*RE Installed Capacity Data are as on 30.09.2023 |
 |
||||||||||||||||||||||||||||||||||||||||||||||||||||||||||||||||||||||
August 2023
(As on 31.08.2023)
*RE Installed Capacity Data are as on 31.08.2023 |
 |
||||||||||||||||||||||||||||||||||||||||||||||||||||||||||||||||||||||
July 2023
(As on 31.07.2023)
*RE Installed Capacity Data are as on 31.07.2023 |
 |
||||||||||||||||||||||||||||||||||||||||||||||||||||||||||||||||||||||
June 2023
(As on 30.06.2023)
*RE Installed Capacity Data are as on 30.06.2023 |
 |
||||||||||||||||||||||||||||||||||||||||||||||||||||||||||||||||||||||
May 2023
(As on 31.05.2023)
*RE Installed Capacity Data are as on 31.05.2023 |
 |
||||||||||||||||||||||||||||||||||||||||||||||||||||||||||||||||||||||
April 2023
(As on 30.04.2023)
*RE Installed Capacity Data are as on 30.04.2023 |
 |
|||||||||||||||||||||||||||||||||||||||||||||||||||||||||||||||||||||||||
March 2023
(As on 31.03.2023)
*RE Installed Capacity Data are as on 31.03.2023 |
 |
||||||||||||||||||||||||||||||||||||||||||||||||
February 2023
(As on 28.02.2023)
*RE Installed Capacity Data are as on 28.02.2023 |
 |
||||||||||||||||||||||||||||||||||||||||||||||||
January 2023
(As on 31.01.2023)
*RE Installed Capacity Data are as on 31.01.2023 |
 |
||||||||||||||||||||||||||||||||||||||||||||||||
December 2022
(As on 31.12.2022)
*RE Installed Capacity Data are as on 31.12.2022 |
 |
||||||||||||||||||||||||||||||||||||||||||||||||
November 2022
(As on 30.11.2022)
*RE Installed Capacity Data are as on 30.11.2022 |
 |
||||||||||||||||||||||||||||||||||||||||||||||||
October 2022
(As on 31.10.2022)
*RE Installed Capacity Data are as on 31.10.2022 |
 |
||||||||||||||||||||||||||||||||||||||||||||||||
September 2022
(As on 30.09.2022)
*RE Installed Capacity Data are as on 30.09.2022 |
 |
||||||||||||||||||||||||||||||||||||||||||||||||
August 2022
(As on 31.08.2022)
*RE Installed Capacity Data are as on 31.08.2022 |
 |
||||||||||||||||||||||||||||||||||||||||||||||||
July 2022
(As on 31.07.2022)
*RE Installed Capacity Data are as on 31.07.2022 |
 |
||||||||||||||||||||||||||||||||||||||||||||||||
June 2022
(As on 30.06.2022)
*RE Installed Capacity Data are as on 30.06.2022 |
 |
||||||||||||||||||||||||||||||||||||||||||||||||
May 2022
(As on 31.05.2022)
*RE Installed Capacity Data are as on 31.05.2022 |
 |
||||||||||||||||||||||||||||||||||||||||||||||||
April 2022
(As on 30.04.2022)
*RE Installed Capacity Data are as on 30.04.2022 |
 |
||||||||||||||||||||||||||||||||||||||||||||||||
March 2022
(As on 31.03.2022)
*RE Installed Capacity Data are as on 31.03.2022 |
 |
||||||||||||||||||||||||||||||||||||||||||||||||
February 2022
(As on 28.02.202)
*RE Installed Capacity Data are as on 28.02.2022 |
 |
||||||||||||||||||||||||||||||||||||||||||||||||
January 2022
(As on 31.01.2022)
*RE Installed Capacity Data are as on 31.01.2022 |
 |
||||||||||||||||||||||||||||||||||||||||||||||||
December 2021
(As on 31.12.2021)
*RE Installed Capacity Data are as on 31.12.2021 |
 |
||||||||||||||||||||||||||||||||||||||||||||||||
November 2021
(As on 30.11.2021)
*RE Installed Capacity Data are as on 30.11.2021 |
 |
||||||||||||||||||||||||||||||||||||||||||||||||
October 2021
(As on 31.10.2021)
*RE Installed Capacity Data are as on 31.10.2021 |
 |
||||||||||||||||||||||||||||||||||||||||||||||||
September 2021
(As on 30.09.2021)
*RE Installed Capacity Data are as on 30.09.2021 |
 |
||||||||||||||||||||||||||||||||||||||||||||||||
August 2021
(As on 31.08.2021)
*RE Installed Capacity Data are as on 31.08.2021 |
 |
||||||||||||||||||||||||||||||||||||||||||||||||
July 2021
(As on 31.07.2021)
*RE Installed Capacity Data are as on 31.07.2021 |
 |
||||||||||||||||||||||||||||||||||||||||||||||||
June 2021
(As on 30.06.2021)
*RE Installed Capacity Data are as on 30.06.2021 |
 |
||||||||||||||||||||||||||||||||||||||||||||||||
May 2021
(As on 31.05.2021)
*RE Installed Capacity Data are as on 31.05.2021 |
 |
||||||||||||||||||||||||||||||||||||||||||||||||
April 2021
(As on 31.04.2021)
*RE Installed Capacity Data are as on 31.04.2021 |
 |
||||||||||||||||||||||||||||||||||||||||||||||||
March 2021
(As on 31.03.2021)
*RE Installed Capacity Data are as on 31.03.2021 |
|
||||||||||||||||||||||||||||||||||||||||||||||||
February 2021
(As on 28.02.2021)
*RE Installed Capacity Data are as on 28.02.2021 |
 |
||||||||||||||||||||||||||||||||||||||||||||||||
January 2021
(As on 31.01.2021)
*RE Installed Capacity Data are as on 31.01.2021 |
 |
||||||||||||||||||||||||||||||||||||||||||||||||
December 2020
(As on 31.12.2020)
*RE Installed Capacity Data are as on 31.12.2020 |
 |
||||||||||||||||||||||||||||||||||||||||||||||||
Nov 2020
(As on 30.11.2020)
*RE Installed Capacity Data are as on 30.11.2020 |
 |
||||||||||||||||||||||||||||||||||||||||||||||||
August 2020
(As on 31.8.2020)
*RE Installed Capacity Data are as on 30.8.2020 |
 |
||||||||||||||||||||||||||||||||||||||||||||||||
June 2020
(As on 30.6.2020)
*RE Installed Capacity Data are as on 31.5.2020 |
 |
||||||||||||||||||||||||||||||||||||||||||||||||
May 2020
(As on 31.5.2020)
|
*RE Installed Capacity Data are as on 31.5.2020 |
 |
||||||||||||||||||||||||||||||||||||||||||||||||
April 2020
(As on 30.4.2020)
|
*RE Installed Capacity Data are as on 30.4.2020 |
 |
||||||||||||||||||||||||||||||||||||||||||||||||
March 2020
(As on 31.3.2020)
|
*RE Installed Capacity Data are as on 31.3.2020 |
 |
||||||||||||||||||||||||||||||||||||||||||||||||
February 2020
(As on 29.02.2020)
|
*RE Installed Capacity Data are as on 29.02.2020 |
|
||||||||||||||||||||||||||||||||||||||||||||||||
January 2020
(As on 31.01.2020)
|
*RE Installed Capacity Data are as on 31.01.2020 |
 |
||||||||||||||||||||||||||||||||||||||||||||||||
December 2019
(As on 30.12.2019)
|
*RE Installed Capacity Data are as on 31.12.2019 |
 |
||||||||||||||||||||||||||||||||||||||||||||||||
November 2019
(As on 30.11.2019)
|
*RE Installed Capacity Data are as on 31.11.2019
|
 |
||||||||||||||||||||||||||||||||||||||||||||||||
October 2019
(As on 31.10.2019)
|
*RE Installed Capacity Data are as on 31.10.2019 |
 |
||||||||||||||||||||||||||||||||||||||||||||||||
September 2019
|
|
 |
|||||||||||||||||||||||||||||||||||||||||||||
August 2019
|
 |
|||||||||||||||||||||||||||||||||||||||||||||||||||
July 2019
|
*RE Installed Capacity Data are as on 30.07.2019 Source: Central Electricity Authority and MNRE |
 |
|||||||||||||||||||||||||||||||||||||||||||||||||||
June 2019
|
*RE Installed Capacity Data are as on 30.06.2019 Source: Central Electricity Authority and MNRE |
 |
|||||||||||||||||||||||||||||||||||||||||||||||||||
May 2019
|
*RE Installed Capacity Data are as on 30.04.2019 Source: Central Electricity Authority and MNRE |
 |
|||||||||||||||||||||||||||||||||||||||||||||||||||
April 2019
|
|
 |
|||||||||||||||||||||||||||||||||||||||||||||||||||||||||
March 2019
|
 |
|||||||||||||||||||||||||||||||||||||||||||||||||||||||||
February 2019
|
 |
||||||||||||||||||||||||||||||||||||||||||||||||||||||
January 2019
|
 |
||||||||||||||||||||||||||||||||||||||||||||||||||||||
December 2018
|
(As on 31.12.2018)
Source: Central Electricity Authority |
 |
|||||||||||||||||||||||||||||||||||||||||||||
November 2018
As on 30.11.2018
* Renewables installed capacity as on 30.09.2018 |
 |
||||||||||||||||||||||||||||||||||||||||||||
October 2018
|
|
 |
||||||||||||||||||||||||||||||||||||||||||||||||||||||
|
September - 2018 |
|||
| Thermal / Renewables | Installed Capacity | 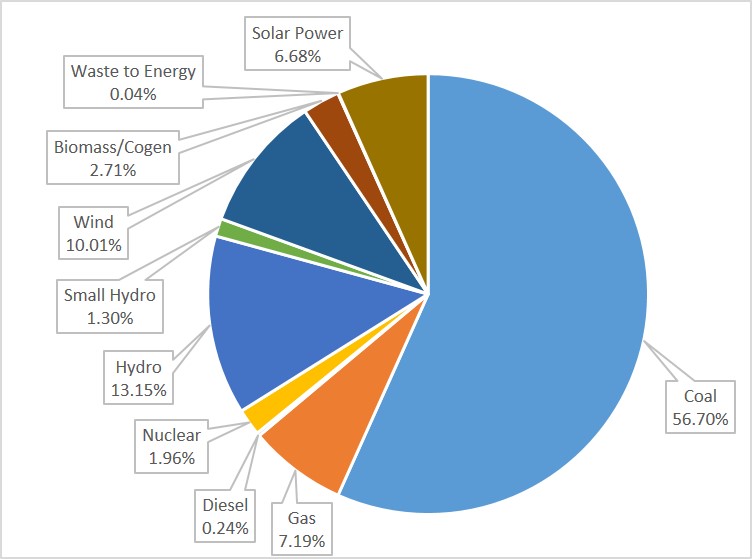 |
|
| MW | % | ||
| Coal | 196097.50 | 56.70% | |
| Gas | 24867.46 | 7.20% | |
| Diesel | 837.63 | 0.24% | |
| Total Thermal | 221802.59 | 64.14% | |
| Nuclear | 6780.00 | 1.96% | |
| Hydro | 45487.42 | 13.15% | |
| Small Hydro | 4506.95 | 1.30% | |
| Wind | 34615.10 | 10.01% | |
| Biomass/Cogen | 9377.61 | 2.71% | |
| Waste to Energy | 138.30 | 0.04% | |
| Solar Power | 23115.07 | 6.68% | |
| Total Renewable | 71753.00 | 20.75% | |
| Grand Total India | 345823.04 | 100.00% | |
Source: Central Electricity Authority
|
August - 2018 |
|||
| Thermal / Renewables | Installed Capacity | 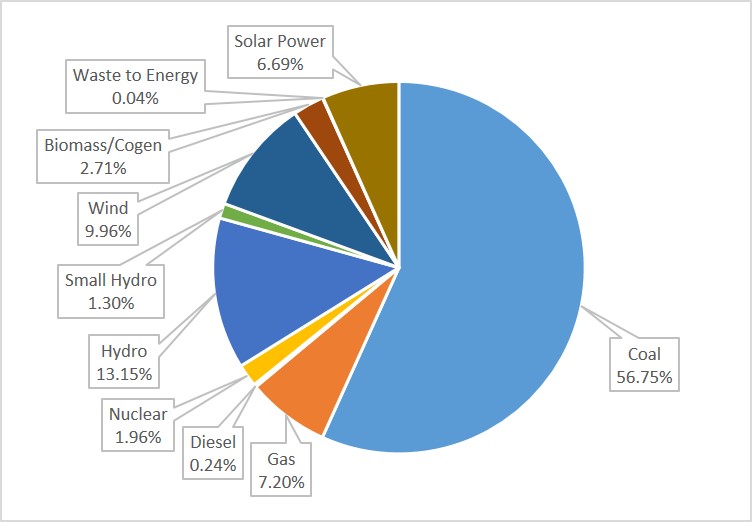 |
|
| MW | % | ||
| Coal | 196097.50 | 56.75% | |
| Gas | 24867.46 | 7.20% | |
| Diesel | 837.63 | 0.24% | |
| Total Thermal | 221802.59 | 64.19% | |
| Nuclear | 6780.00 | 1.96% | |
| Hydro | 45457.42 | 13.15% | |
| Small Hydro | 4493.20 | 1.30% | |
| Wind | 34402.12 | 9.96% | |
| Biomass/Cogen | 9377.61 | 2.71% | |
| Waste to Energy | 138.30 | 0.04% | |
| Solar Power | 23115.07 | 6.69% | |
| Total Renewable | 71526.00 | 20.70% | |
| Grand Total India | 345566.31 | 100.00% | |
Source: Central Electricity Authority
|
July - 2018 |
|||
| Thermal / Renewables | Installed Capacity | 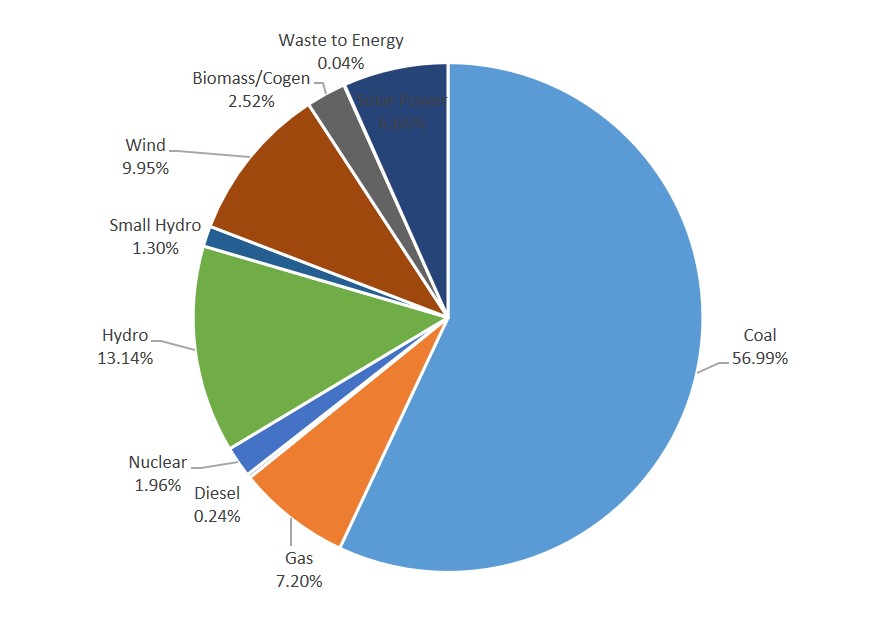 |
|
| MW | % | ||
| Coal | 196957.50 | 57.00% | |
| Gas | 24897.46 | 7.21% | |
| Diesel | 837.63 | 1.19% | |
| Total Thermal | 222692.59 | 64.45% | |
| Nuclear | 6780.00 | 1.96% | |
| Hydro | 45403.42 | 13.14% | |
| Small Hydro | 4493.20 | 1.30% | |
| Wind | 34293.00 | 9.93% | |
| Biomass/Cogen | 8700.80 | 2.52% | |
| Waste to Energy | 138.30 | 0.04% | |
| Solar Power | 23022.83 | 6.66% | |
| Total Renewable | 70648.00 | 20.45% | |
| Grand Total India | 345524.62 | 100.00% | |
Source: Central Electricity Authority
|
June - 2018 |
|||
| Thermal / Renewables | Installed Capacity | 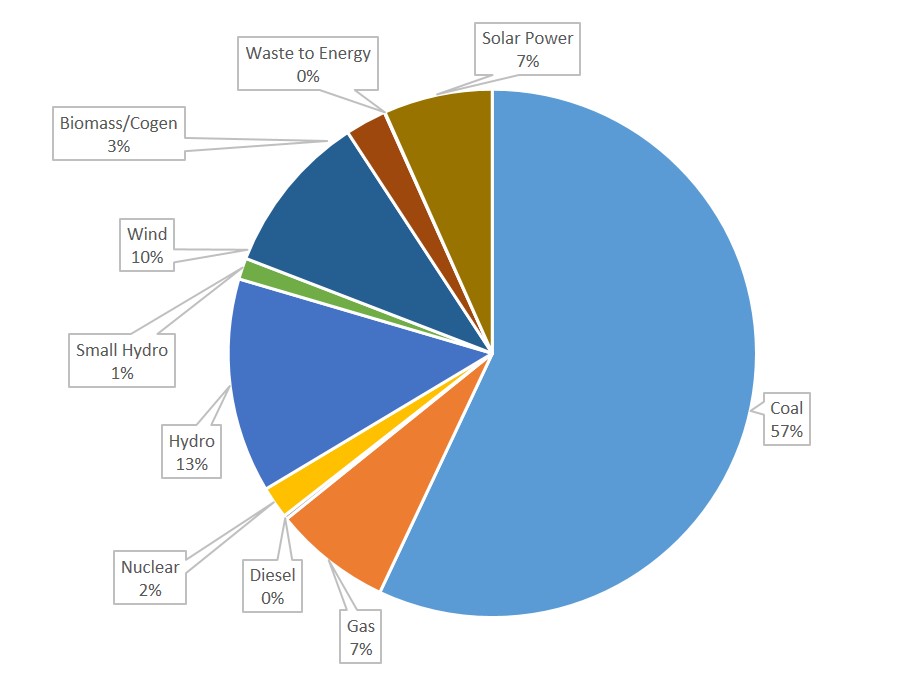 |
|
| MW | % | ||
| Coal | 196957.50 | 57.00% | |
| Gas | 24897.46 | 7.21% | |
| Diesel | 837.63 | 1.19% | |
| Total Thermal | 222692.59 | 64.60% | |
| Nuclear | 6780.00 | 1.96% | |
| Hydro | 45403.42 | 13.14% | |
| Small Hydro | 4493.20 | 1.30% | |
| Wind | 34293.48 | 9.93% | |
| Biomass/Cogen | 8700.80 | 2.52% | |
| Waste to Energy | 138.30 | 0.04% | |
| Solar Power | 23022.83 | 6.66% | |
| Total Renewable | 70448.61 | 20.45% | |
| Grand Total India | 345524.62 | 100.00% | |
Source: Central Electricity Authority
|
May - 2018 |
|||
| Thermal / Renewables | Installed Capacity |  |
|
| MW | % | ||
| Coal | 196957.50 | 57.23% | |
| Gas | 24897.46 | 7.22% | |
| Diesel | 837.63 | 1.20% | |
| Total Thermal | 222692.59 | 64.60% | |
| Nuclear | 6780.00 | 1.97% | |
| Hydro | 45293.42 | 13.17% | |
| Small Hydro | 4493.20 | 1.30% | |
| Wind | 34193.20 | 9.92% | |
| Biomass/Cogen | 8700.80 | 2.52% | |
| Waste to Energy | 138.30 | 0.04% | |
| Solar Power | 21329.39 | 6.48% | |
| Total Renewable | 69854.89 | 20.26% | |
| Grand Total India | 344730.90 | 100.00% | |
Source: Central Electricity Authority
|
April - 2018 |
|||
| Thermal / Renewables | Installed Capacity | 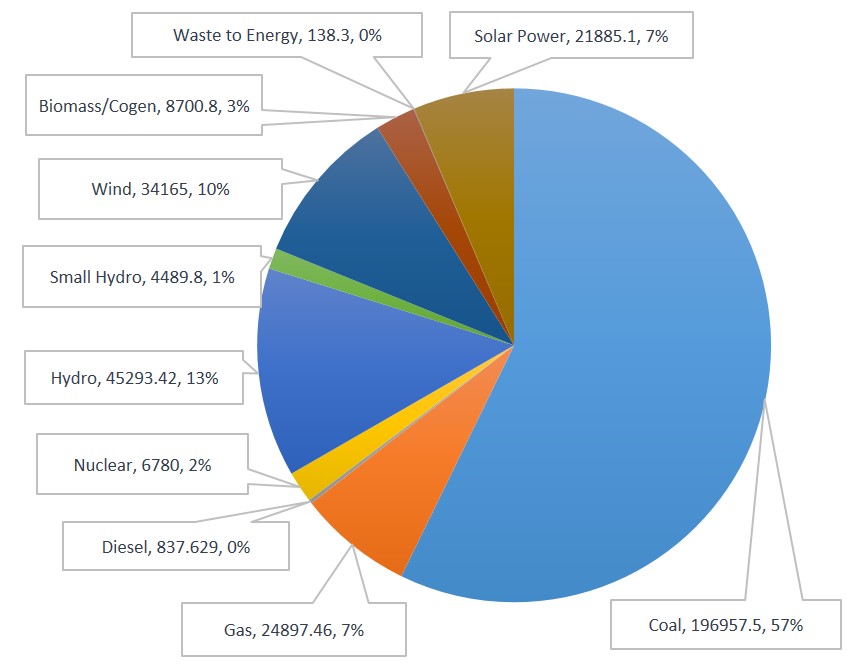 |
|
| MW | % | ||
| Coal | 196957.50 | 57.23% | |
| Gas | 24897.46 | 7.23% | |
| Diesel | 837.63 | 0.24% | |
| Total Thermal | 222692.59 | 64.71% | |
| Nuclear | 6780.00 | 1.97% | |
| Hydro | 45293.42 | 13.16% | |
| Small Hydro | 4489.80 | 1.30% | |
| Wind | 34165.00 | 9.93% | |
| Biomass/Cogen | 8700.80 | 2.53% | |
| Waste to Energy | 138.30 | 0.04% | |
| Solar Power | 21885.10 | 6.36% | |
| Total Renewable | 69379.00 | 20.16% | |
| Grand Total India | 344145.01 | 100.00% | |
Source: Central Electricity Authority
|
March - 2018 |
|||
| Thermal / Renewables | Installed Capacity | 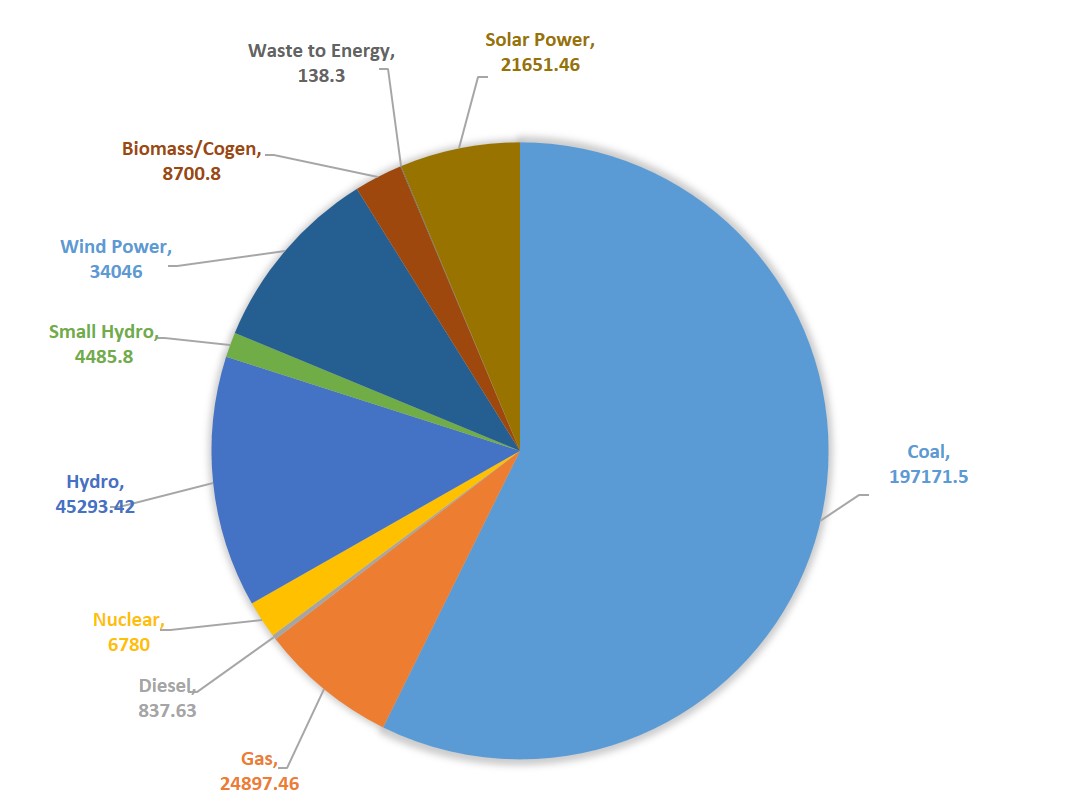 |
|
| MW | % | ||
| Coal | 197171.50 | 57.32% | |
| Gas | 24897.46 | 7.24% | |
| Diesel | 837.63 | 0.24% | |
| Total Thermal | 222906.59 | 64.80% | |
| Nuclear | 6780.00 | 1.97% | |
| Hydro | 45293.42 | 13.17% | |
| Small Hydro | 4485.80 | 1.30% | |
| Wind | 34046.00 | 9.90% | |
| Biomass/Cogen | 8700.8 | 2.53% | |
| Waste to Energy | 138.03 | 0.04% | |
| Solar Power | 21561.46 | 6.29% | |
| Total Renewable | 69022.36 | 20.06% | |
| Grand Total India | 344002.37 | 100.00% | |
Source: Central Electricity Authority
|
February - 2018 |
|||
| Thermal / Renewables | Installed Capacity |  |
|
| MW | % | ||
| Coal | 193821.50 | 57.54% | |
| Gas | 24897.46 | 7.39% | |
| Diesel | 837.63 | 0.25% | |
| Total Thermal | 219556.59 | 65.18% | |
| Nuclear | 6780.00 | 2.01% | |
| Hydro | 44963.42 | 13.35% | |
| Small Hydro | 4476.65 | 1.33% | |
| Wind | 32957.86 | 9.78% | |
| Biomass/Cogen | 8413.8 | 2.50% | |
| Waste to Energy | 114.08 | 0.03% | |
| Solar Power | 19584.15 | 5.81% | |
| Total Renewable | 64314.19 | 19.46% | |
| Grand Total India | 336846.55 | 100.00% | |
Source: Central Electricity Authority
|
January - 2018 |
|||
| Thermal / Renewables | Installed Capacity |  |
|
| MW | % | ||
| Coal | 193821.50 | 57.71% | |
| Gas | 25150.38 | 7.49% | |
| Diesel | 837.63 | 0.25% | |
| Total Thermal | 219809.51 | 65.45% | |
| Nuclear | 6780.00 | 2.02% | |
| Hydro | 44963.42 | 13.39% | |
| Small Hydro | 4453.65 | 1.33% | |
| Wind | 32877.66 | 9.79% | |
| Biomass/Cogen | 8413.8 | 2.51% | |
| Waste to Energy | 114.08 | 0.03% | |
| Solar Power | 18455.19 | 5.49% | |
| Total Renewable | 64314.19 | 18.17% | |
| Grand Total India | 335867.12 | 100.00% | |
Source: Central Electricity Authority
About Portal
'All About Renewables' aims to bring about a change in the way we 'look and search' for data on renewables today, by providing access to the latest developments in the renewable energy sector (specifically renewable electricity), along with cross-linkages to the conventional energy sector, all on one single platform... Read More
About
Useful Links
Contact
Plot No.44, Hindustan Estates,
Kalyani Nagar, Pune 411 006, India
+91 20 26613855
+91 20 26613832