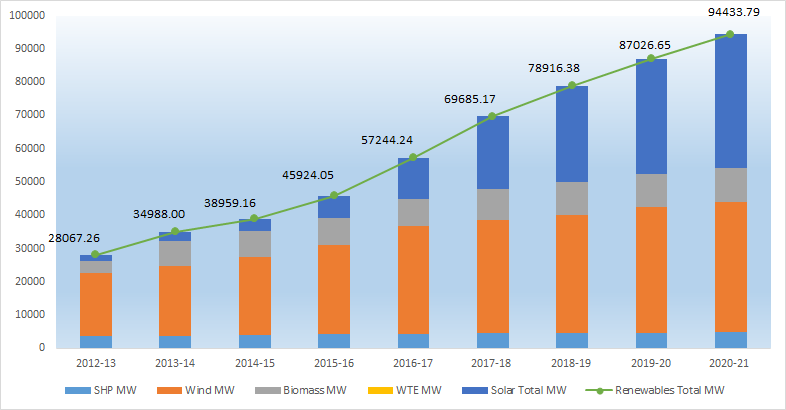
India has witnessed rapid year wise growth in renewable energy installed capacity between 2012-13 and 2018-19. Compound annual growth rate (CAGR) of renewable installed capacity during the same period has been 18.80% which prompted a whopping 2.8 times increase in renewable installed capacity.
Solar technology has witnessed the highest CAGR (60.46%) during the period followed by biomass (18.12%), wind (11.00%), waste to energy (6.26%) and small hydro (3.99%) respectively. The solar energy installed capacity has increased the maximum. For solar energy, installed capacity in the end of 2018-19 was 20 times than that in the end of 2012-13. The share of solar technology in total installed capacity has increased from 6.01% in 2012-13 to 36.47% in 2018-19. For all other technologies, share in total renewable installed capacity has decreased between 2012-13 and 2018-19. Share of wind has decreased from 67.88% to 45.14%, share of biomass has decreased from 12.83% to 12.39%, share of SHP has decreased from 12.94% to 5.82% and the share of waste to energy has decreased from 0.34% to 0.18% between the same time interval.
|
Year |
SHP |
Wind |
Biomass |
WTE |
Solar Total |
Renewables Total |
|
|
MW |
MW |
MW |
MW |
MW |
MW |
|
2012-13 |
3632.25 |
19051.46 |
3601.03 |
96.08 |
1686.44 |
28067.26 |
|
2013-14 |
3803.68 |
21042.58 |
7419.23 |
90.58 |
2631.93 |
34988.00 |
|
2014-15 |
4055.36 |
23354.35 |
7714.90 |
90.58 |
3743.97 |
38959.16 |
|
2015-16 |
4273.47 |
26777.40 |
8019.75 |
90.58 |
6762.85 |
45924.05 |
|
2016-17 |
4379.86 |
32279.77 |
8181.70 |
114.08 |
12288.83 |
57244.24 |
|
2017-18 |
4485.80 |
34046.00 |
9363.61 |
138.30 |
21651.46 |
69685.17 |
|
2018-19 |
4593.15 |
35625.97 |
9778.30 |
138.30 |
28780.66 |
78916.38 |
|
2019-20 |
4683.16 |
37693.75 |
9875.31 |
146.64 |
34627.79 |
87026.65 |
|
2020-21 |
4786.81 |
39247.05 |
10145.92 |
168.64 |
40085.37 |
94433.79 |
|
2021-22 |
4848.9 |
40357.58 |
10205.61 |
476.75 |
53996.54 |
109885.38 |
|
2022-23 |
4944.3 |
42633.13 |
10248.01 |
554.03 |
66780.34 |
125159.81 |
Source: MNRE, CEA